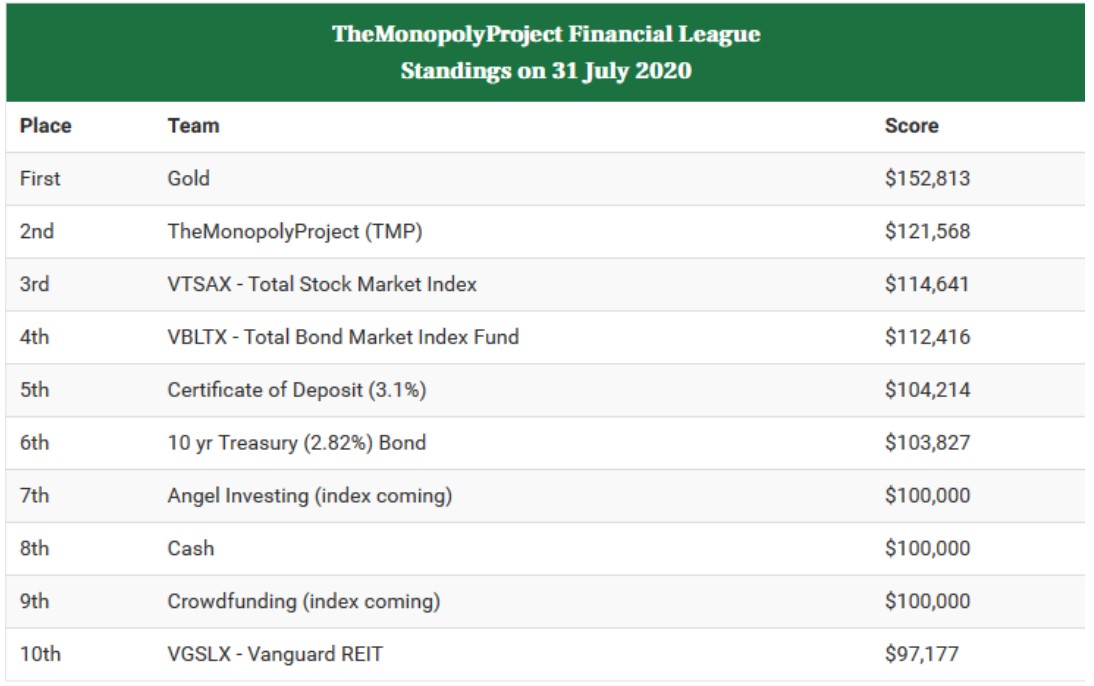
[fusion_builder_container hundred_percent=”no” hundred_percent_height=”no” hundred_percent_height_scroll=”no” hundred_percent_height_center_content=”yes” equal_height_columns=”no” menu_anchor=”” hide_on_mobile=”small-visibility,medium-visibility,large-visibility” status=”published” publish_date=”” class=”” id=”” link_color=”” link_hover_color=”” border_size=”” border_color=”” border_style=”solid” margin_top=”” margin_bottom=”” padding_top=”” padding_right=”” padding_bottom=”” padding_left=”” gradient_start_color=”” gradient_end_color=”” gradient_start_position=”0″ gradient_end_position=”100″ gradient_type=”linear” radial_direction=”center center” linear_angle=”180″ background_color=”” background_image=”” background_position=”center center” background_repeat=”no-repeat” fade=”no” background_parallax=”none” enable_mobile=”no” parallax_speed=”0.3″ background_blend_mode=”none” video_mp4=”” video_webm=”” video_ogv=”” video_url=”” video_aspect_ratio=”16:9″ video_loop=”yes” video_mute=”yes” video_preview_image=”” filter_hue=”0″ filter_saturation=”100″ filter_brightness=”100″ filter_contrast=”100″ filter_invert=”0″ filter_sepia=”0″ filter_opacity=”100″ filter_blur=”0″ filter_hue_hover=”0″ filter_saturation_hover=”100″ filter_brightness_hover=”100″ filter_contrast_hover=”100″ filter_invert_hover=”0″ filter_sepia_hover=”0″ filter_opacity_hover=”100″ filter_blur_hover=”0″][fusion_builder_row][fusion_builder_column type=”1_1″ layout=”1_1″ spacing=”” center_content=”no” link=”” target=”_self” min_height=”” hide_on_mobile=”small-visibility,medium-visibility,large-visibility” class=”” id=”” hover_type=”none” border_size=”0″ border_color=”” border_style=”solid” border_position=”all” border_radius=”” box_shadow=”no” dimension_box_shadow=”” box_shadow_blur=”0″ box_shadow_spread=”0″ box_shadow_color=”” box_shadow_style=”” padding_top=”” padding_right=”” padding_bottom=”” padding_left=”” margin_top=”” margin_bottom=”” background_type=”single” gradient_start_color=”” gradient_end_color=”” gradient_start_position=”0″ gradient_end_position=”100″ gradient_type=”linear” radial_direction=”center center” linear_angle=”180″ background_color=”” background_image=”” background_image_id=”” background_position=”left top” background_repeat=”no-repeat” background_blend_mode=”none” animation_type=”” animation_direction=”left” animation_speed=”0.3″ animation_offset=”” filter_type=”regular” filter_hue=”0″ filter_saturation=”100″ filter_brightness=”100″ filter_contrast=”100″ filter_invert=”0″ filter_sepia=”0″ filter_opacity=”100″ filter_blur=”0″ filter_hue_hover=”0″ filter_saturation_hover=”100″ filter_brightness_hover=”100″ filter_contrast_hover=”100″ filter_invert_hover=”0″ filter_sepia_hover=”0″ filter_opacity_hover=”100″ filter_blur_hover=”0″ last=”no”][fusion_text columns=”” column_min_width=”” column_spacing=”” rule_style=”default” rule_size=”” rule_color=”” hide_on_mobile=”small-visibility,medium-visibility,large-visibility” class=”” id=”” animation_type=”” animation_direction=”left” animation_speed=”0.3″ animation_offset=””]Now that July 2020 is completed, TMP is still comfortably in second place in “The Financial League”.
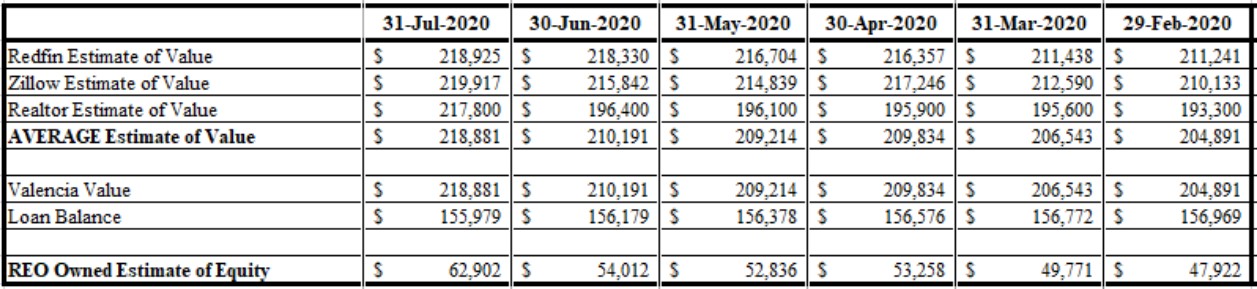
TheMonopolyProject (TMP) showed a huge $8,690 jump due to increases in the estimated value by Zillow and Realtor. Over $21,000 in the case of Realtor.com! In one month!
‘Gold’ extended it’s First Place lead by gaining another $14,824 this month during the COVID19 and now riot era. Gold jumped from $1,784/oz to 1,976/oz; 11% in one month.[/fusion_text][fusion_separator style_type=”none” hide_on_mobile=”small-visibility,medium-visibility,large-visibility” class=”” id=”” sep_color=”” top_margin=”20″ bottom_margin=”” border_size=”” icon=”” icon_size=”” icon_circle=”” icon_circle_color=”” width=”” alignment=”center” /][fusion_imageframe image_id=”2183|full” max_width=”” style_type=”” blur=”” stylecolor=”” hover_type=”none” bordersize=”” bordercolor=”” borderradius=”” align=”center” lightbox=”no” gallery_id=”” lightbox_image=”” lightbox_image_id=”” alt=”” link=”” linktarget=”_self” hide_on_mobile=”small-visibility,medium-visibility,large-visibility” class=”” id=”” animation_type=”” animation_direction=”left” animation_speed=”0.3″ animation_offset=”” filter_hue=”0″ filter_saturation=”100″ filter_brightness=”100″ filter_contrast=”100″ filter_invert=”0″ filter_sepia=”0″ filter_opacity=”100″ filter_blur=”0″ filter_hue_hover=”0″ filter_saturation_hover=”100″ filter_brightness_hover=”100″ filter_contrast_hover=”100″ filter_invert_hover=”0″ filter_sepia_hover=”0″ filter_opacity_hover=”100″ filter_blur_hover=”0″]https://themonopolyproject.com/wp-content/uploads/2020/08/Financial-League-July-31-2020.jpg[/fusion_imageframe][fusion_separator style_type=”none” hide_on_mobile=”small-visibility,medium-visibility,large-visibility” class=”” id=”” sep_color=”” top_margin=”20″ bottom_margin=”” border_size=”” icon=”” icon_size=”” icon_circle=”” icon_circle_color=”” width=”” alignment=”center” /][fusion_text columns=”” column_min_width=”” column_spacing=”” rule_style=”default” rule_size=”” rule_color=”” hide_on_mobile=”small-visibility,medium-visibility,large-visibility” class=”” id=”” animation_type=”” animation_direction=”left” animation_speed=”0.3″ animation_offset=””]Here’s the last six months:[/fusion_text][fusion_separator style_type=”none” hide_on_mobile=”small-visibility,medium-visibility,large-visibility” class=”” id=”” sep_color=”” top_margin=”20″ bottom_margin=”” border_size=”” icon=”” icon_size=”” icon_circle=”” icon_circle_color=”” width=”” alignment=”center” /][fusion_imageframe image_id=”2184|full” max_width=”” style_type=”” blur=”” stylecolor=”” hover_type=”none” bordersize=”” bordercolor=”” borderradius=”” align=”center” lightbox=”no” gallery_id=”” lightbox_image=”” lightbox_image_id=”” alt=”” link=”” linktarget=”_self” hide_on_mobile=”small-visibility,medium-visibility,large-visibility” class=”” id=”” animation_type=”” animation_direction=”left” animation_speed=”0.3″ animation_offset=”” filter_hue=”0″ filter_saturation=”100″ filter_brightness=”100″ filter_contrast=”100″ filter_invert=”0″ filter_sepia=”0″ filter_opacity=”100″ filter_blur=”0″ filter_hue_hover=”0″ filter_saturation_hover=”100″ filter_brightness_hover=”100″ filter_contrast_hover=”100″ filter_invert_hover=”0″ filter_sepia_hover=”0″ filter_opacity_hover=”100″ filter_blur_hover=”0″]https://themonopolyproject.com/wp-content/uploads/2020/08/Last-Six-Months.jpg[/fusion_imageframe][fusion_separator style_type=”none” hide_on_mobile=”small-visibility,medium-visibility,large-visibility” class=”” id=”” sep_color=”” top_margin=”20″ bottom_margin=”” border_size=”” icon=”” icon_size=”” icon_circle=”” icon_circle_color=”” width=”” alignment=”center” /][fusion_text columns=”” column_min_width=”” column_spacing=”” rule_style=”default” rule_size=”” rule_color=”” hide_on_mobile=”small-visibility,medium-visibility,large-visibility” class=”” id=”” animation_type=”” animation_direction=”left” animation_speed=”0.3″ animation_offset=””]
TheMonopolyProject formula for TOTAL EQUITY is:
TOTAL EQUITY of TMP = ‘Bank Account’ + ‘1 SHF – estimated equity’ = $121,568
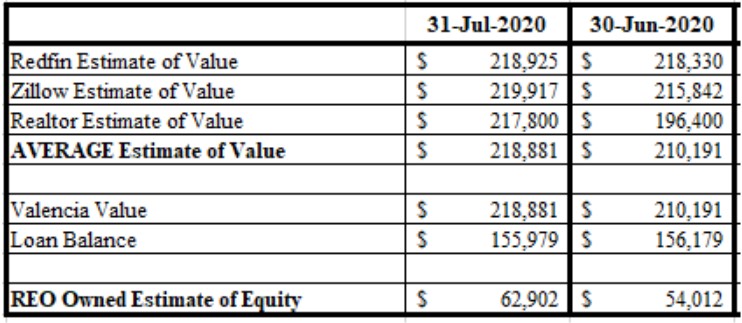
How did we get to the ‘REO Owned Estimate of Equity’ of $54,012 for the month of June?
We used the arithmetic average of three websites (Redfin, Zillow, Realtor.com) that estimate home values.
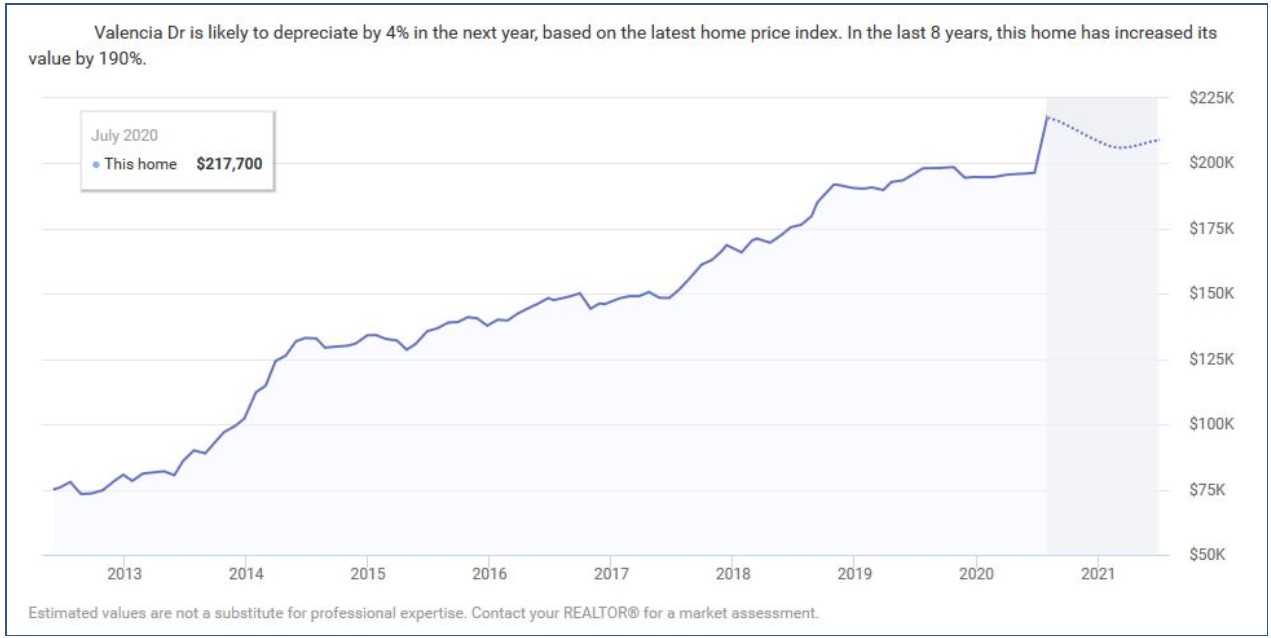
[/fusion_text][fusion_separator style_type=”none” hide_on_mobile=”small-visibility,medium-visibility,large-visibility” class=”” id=”” sep_color=”” top_margin=”20″ bottom_margin=”” border_size=”” icon=”” icon_size=”” icon_circle=”” icon_circle_color=”” width=”” alignment=”center” /][fusion_imageframe image_id=”2185|full” max_width=”” style_type=”” blur=”” stylecolor=”” hover_type=”none” bordersize=”” bordercolor=”” borderradius=”” align=”center” lightbox=”no” gallery_id=”” lightbox_image=”” lightbox_image_id=”” alt=”” link=”” linktarget=”_self” hide_on_mobile=”small-visibility,medium-visibility,large-visibility” class=”” id=”” animation_type=”” animation_direction=”left” animation_speed=”0.3″ animation_offset=”” filter_hue=”0″ filter_saturation=”100″ filter_brightness=”100″ filter_contrast=”100″ filter_invert=”0″ filter_sepia=”0″ filter_opacity=”100″ filter_blur=”0″ filter_hue_hover=”0″ filter_saturation_hover=”100″ filter_brightness_hover=”100″ filter_contrast_hover=”100″ filter_invert_hover=”0″ filter_sepia_hover=”0″ filter_opacity_hover=”100″ filter_blur_hover=”0″]https://themonopolyproject.com/wp-content/uploads/2020/08/REO-Estimate.jpg[/fusion_imageframe][fusion_separator style_type=”none” hide_on_mobile=”small-visibility,medium-visibility,large-visibility” class=”” id=”” sep_color=”” top_margin=”20″ bottom_margin=”” border_size=”” icon=”” icon_size=”” icon_circle=”” icon_circle_color=”” width=”” alignment=”center” /][fusion_text columns=”” column_min_width=”” column_spacing=”” rule_style=”default” rule_size=”” rule_color=”” hide_on_mobile=”small-visibility,medium-visibility,large-visibility” class=”” id=”” animation_type=”” animation_direction=”left” animation_speed=”0.3″ animation_offset=””]The Realtor.com estimate jumped by $21,400 in one month. The Zillow estimate jumped over $4,000. We take a closer look at the numbers:[/fusion_text][fusion_separator style_type=”none” hide_on_mobile=”small-visibility,medium-visibility,large-visibility” class=”” id=”” sep_color=”” top_margin=”20″ bottom_margin=”” border_size=”” icon=”” icon_size=”” icon_circle=”” icon_circle_color=”” width=”” alignment=”center” /][fusion_youtube id=”UGKv7_f1ipI” alignment=”center” width=”” height=”” autoplay=”false” api_params=”” hide_on_mobile=”small-visibility,medium-visibility,large-visibility” class=”” css_id=”” /][fusion_separator style_type=”none” hide_on_mobile=”small-visibility,medium-visibility,large-visibility” class=”” id=”” sep_color=”” top_margin=”20″ bottom_margin=”” border_size=”” icon=”” icon_size=”” icon_circle=”” icon_circle_color=”” width=”” alignment=”center” /][fusion_text columns=”” column_min_width=”” column_spacing=”” rule_style=”default” rule_size=”” rule_color=”” hide_on_mobile=”small-visibility,medium-visibility,large-visibility” class=”” id=”” animation_type=”” animation_direction=”left” animation_speed=”0.3″ animation_offset=””]You can see the $21,400 jump in one month in the chart below. Note that the estimates before this were below the purchase price. Also, Realtor predicts a decrease in price of 4% over the next year?[/fusion_text][fusion_separator style_type=”none” hide_on_mobile=”small-visibility,medium-visibility,large-visibility” class=”” id=”” sep_color=”” top_margin=”20″ bottom_margin=”” border_size=”” icon=”” icon_size=”” icon_circle=”” icon_circle_color=”” width=”” alignment=”center” /][fusion_imageframe image_id=”2186|full” max_width=”” style_type=”” blur=”” stylecolor=”” hover_type=”none” bordersize=”” bordercolor=”” borderradius=”” align=”center” lightbox=”no” gallery_id=”” lightbox_image=”” lightbox_image_id=”” alt=”” link=”” linktarget=”_self” hide_on_mobile=”small-visibility,medium-visibility,large-visibility” class=”” id=”” animation_type=”” animation_direction=”left” animation_speed=”0.3″ animation_offset=”” filter_hue=”0″ filter_saturation=”100″ filter_brightness=”100″ filter_contrast=”100″ filter_invert=”0″ filter_sepia=”0″ filter_opacity=”100″ filter_blur=”0″ filter_hue_hover=”0″ filter_saturation_hover=”100″ filter_brightness_hover=”100″ filter_contrast_hover=”100″ filter_invert_hover=”0″ filter_sepia_hover=”0″ filter_opacity_hover=”100″ filter_blur_hover=”0″]https://themonopolyproject.com/wp-content/uploads/2020/08/Price-Graph.jpg[/fusion_imageframe][fusion_separator style_type=”none” hide_on_mobile=”small-visibility,medium-visibility,large-visibility” class=”” id=”” sep_color=”” top_margin=”20″ bottom_margin=”” border_size=”” icon=”” icon_size=”” icon_circle=”” icon_circle_color=”” width=”” alignment=”center” /][fusion_text columns=”” column_min_width=”” column_spacing=”” rule_style=”default” rule_size=”” rule_color=”” hide_on_mobile=”small-visibility,medium-visibility,large-visibility” class=”” id=”” animation_type=”” animation_direction=”left” animation_speed=”0.3″ animation_offset=””]This raises the question of how these estimates are generated. A review of the Zillow model states:
Realtors are obviously suspicious of Zillow and the Zestimate.
Is Redfin better than Zillow? Yes?
And how does Realtor.com calculate home values? How can the model show a $21,400 or 11% jump in one month? We’ll ask our TMP expert broker/agent, Jeff Sutherlin.
The Phoenix home market is hot with prices reported to have risen 9% over the last year. “With a 9% year-over-year gain in May among 19 cities measured by the S&P CoreLogic Case-Shiller U.S. National Home Price NSA Index, Phoenix…” The Valencia house has appreciated 11% in a little over a year based on the average of the three (Redfin, Zillow, Realtor) estimates.[/fusion_text][/fusion_builder_column][/fusion_builder_row][/fusion_builder_container]