[fusion_builder_container hundred_percent=”no” hundred_percent_height=”no” hundred_percent_height_scroll=”no” hundred_percent_height_center_content=”yes” equal_height_columns=”no” menu_anchor=”” hide_on_mobile=”small-visibility,medium-visibility,large-visibility” status=”published” publish_date=”” class=”” id=”” border_size=”” border_color=”” border_style=”solid” margin_top=”” margin_bottom=”” padding_top=”” padding_right=”” padding_bottom=”” padding_left=”” gradient_start_color=”” gradient_end_color=”” gradient_start_position=”0″ gradient_end_position=”100″ gradient_type=”linear” radial_direction=”center” linear_angle=”180″ background_color=”” background_image=”” background_position=”center center” background_repeat=”no-repeat” fade=”no” background_parallax=”none” enable_mobile=”no” parallax_speed=”0.3″ background_blend_mode=”none” video_mp4=”” video_webm=”” video_ogv=”” video_url=”” video_aspect_ratio=”16:9″ video_loop=”yes” video_mute=”yes” video_preview_image=”” filter_hue=”0″ filter_saturation=”100″ filter_brightness=”100″ filter_contrast=”100″ filter_invert=”0″ filter_sepia=”0″ filter_opacity=”100″ filter_blur=”0″ filter_hue_hover=”0″ filter_saturation_hover=”100″ filter_brightness_hover=”100″ filter_contrast_hover=”100″ filter_invert_hover=”0″ filter_sepia_hover=”0″ filter_opacity_hover=”100″ filter_blur_hover=”0″][fusion_builder_row][fusion_builder_column type=”1_1″ layout=”1_1″ spacing=”” center_content=”no” link=”” target=”_self” min_height=”” hide_on_mobile=”small-visibility,medium-visibility,large-visibility” class=”” id=”” hover_type=”none” border_size=”0″ border_color=”” border_style=”solid” border_position=”all” border_radius=”” box_shadow=”no” dimension_box_shadow=”” box_shadow_blur=”0″ box_shadow_spread=”0″ box_shadow_color=”” box_shadow_style=”” padding_top=”” padding_right=”” padding_bottom=”” padding_left=”” margin_top=”” margin_bottom=”” background_type=”single” gradient_start_color=”” gradient_end_color=”” gradient_start_position=”0″ gradient_end_position=”100″ gradient_type=”linear” radial_direction=”center” linear_angle=”180″ background_color=”” background_image=”” background_image_id=”” background_position=”left top” background_repeat=”no-repeat” background_blend_mode=”none” animation_type=”” animation_direction=”left” animation_speed=”0.3″ animation_offset=”” filter_type=”regular” filter_hue=”0″ filter_saturation=”100″ filter_brightness=”100″ filter_contrast=”100″ filter_invert=”0″ filter_sepia=”0″ filter_opacity=”100″ filter_blur=”0″ filter_hue_hover=”0″ filter_saturation_hover=”100″ filter_brightness_hover=”100″ filter_contrast_hover=”100″ filter_invert_hover=”0″ filter_sepia_hover=”0″ filter_opacity_hover=”100″ filter_blur_hover=”0″ last=”no”][fusion_text columns=”” column_min_width=”” column_spacing=”” rule_style=”default” rule_size=”” rule_color=”” hide_on_mobile=”small-visibility,medium-visibility,large-visibility” class=”” id=”” animation_type=”” animation_direction=”left” animation_speed=”0.3″ animation_offset=””]
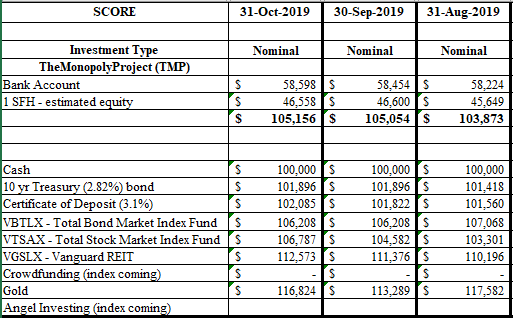
Our results to date are reported on a monthly basis on the “Score” table on the Home page. We give you the current total value of TheMonopolyProject (TMP) as a combination of cash held (bank deposits) and the estimated equity of the real estate owned (= estimated value minus liabilities).
To determine how well TMP project is doing we compare it to the other financial investments we could have made with the $100,000. This is known as the ‘opportunity cost’. Note that we could also consider other, non-financial investment uses for the $100,000. We will discuss that later. Life is not all about optimizing financial outcomes in this kingdom.
We started TMP on March 1, 2019. On March 1st, 2019, all 10 investments started at the same nominal value, $100,000.
Now that September is completed, we have our results, the “Standings”. It’s easiest to think of this as a football or baseball sports league: The Financial League. We’re one of ten teams competing for First Place in the league.
‘Gold’ is still solidly in First Place.
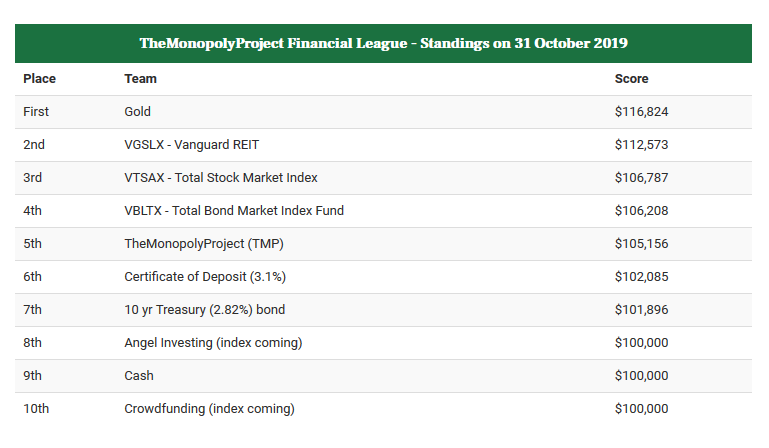
[/fusion_text][fusion_separator style_type=”none” hide_on_mobile=”small-visibility,medium-visibility,large-visibility” class=”” id=”” sep_color=”” top_margin=”0″ bottom_margin=”20px” border_size=”0″ icon=”” icon_circle=”” icon_circle_color=”” width=”” alignment=”center” /][fusion_imageframe image_id=”1892|full” max_width=”” style_type=”” blur=”” stylecolor=”” hover_type=”none” bordersize=”” bordercolor=”” borderradius=”” align=”center” lightbox=”no” gallery_id=”” lightbox_image=”” lightbox_image_id=”” alt=”” link=”” linktarget=”_self” hide_on_mobile=”small-visibility,medium-visibility,large-visibility” class=”” id=”” animation_type=”” animation_direction=”left” animation_speed=”0.3″ animation_offset=””]https://themonopolyproject.com/wp-content/uploads/2019/11/oct-31-2019-stats.png[/fusion_imageframe][fusion_separator style_type=”none” hide_on_mobile=”small-visibility,medium-visibility,large-visibility” class=”” id=”” sep_color=”” top_margin=”0″ bottom_margin=”15px” border_size=”0″ icon=”” icon_circle=”” icon_circle_color=”” width=”” alignment=”center” /][fusion_text columns=”” column_min_width=”” column_spacing=”” rule_style=”default” rule_size=”” rule_color=”” hide_on_mobile=”small-visibility,medium-visibility,large-visibility” class=”” id=”” animation_type=”” animation_direction=”left” animation_speed=”0.3″ animation_offset=””]Even though we inched up $102 in value, we fell to 5th place since VTSAX, the Vanguard broad stock market fund, jumped back up. Here’s a direct comparison of the three months results:[/fusion_text][fusion_imageframe image_id=”1893|full” max_width=”” style_type=”” blur=”” stylecolor=”” hover_type=”none” bordersize=”” bordercolor=”” borderradius=”” align=”center” lightbox=”no” gallery_id=”” lightbox_image=”” lightbox_image_id=”” alt=”” link=”” linktarget=”_self” hide_on_mobile=”small-visibility,medium-visibility,large-visibility” class=”” id=”” animation_type=”” animation_direction=”left” animation_speed=”0.3″ animation_offset=””]https://themonopolyproject.com/wp-content/uploads/2019/11/aug-sep-oct-score.png[/fusion_imageframe][fusion_separator style_type=”none” hide_on_mobile=”small-visibility,medium-visibility,large-visibility” class=”” id=”” sep_color=”” top_margin=”0″ bottom_margin=”15px” border_size=”0″ icon=”” icon_circle=”” icon_circle_color=”” width=”” alignment=”center” /][fusion_text columns=”” column_min_width=”” column_spacing=”” rule_style=”default” rule_size=”” rule_color=”” hide_on_mobile=”small-visibility,medium-visibility,large-visibility” class=”” id=”” animation_type=”” animation_direction=”left” animation_speed=”0.3″ animation_offset=””]
For TheMonopolyProject our formula for TOTAL EQUITY is:
TOTAL EQUITY of TMP = ‘Bank Account’ + ‘1 SHF – estimated equity’ = $105,156
How did we get to the ‘REO Owned Estimate of Equity’ of $46,558 for the month of October?
We used the arithmetic average of the three websites (Redfin, Zillow, Realtor.com).
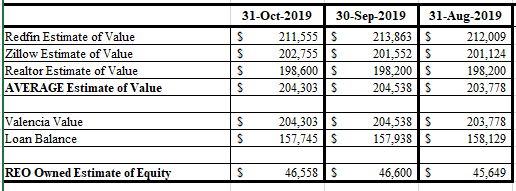
[/fusion_text][fusion_imageframe image_id=”1894|full” max_width=”” style_type=”” blur=”” stylecolor=”” hover_type=”none” bordersize=”” bordercolor=”” borderradius=”” align=”center” lightbox=”no” gallery_id=”” lightbox_image=”” lightbox_image_id=”” alt=”” link=”” linktarget=”_self” hide_on_mobile=”small-visibility,medium-visibility,large-visibility” class=”” id=”” animation_type=”” animation_direction=”left” animation_speed=”0.3″ animation_offset=””]https://themonopolyproject.com/wp-content/uploads/2019/11/aug-sep-oct-reo.png[/fusion_imageframe][fusion_separator style_type=”none” hide_on_mobile=”small-visibility,medium-visibility,large-visibility” class=”” id=”” sep_color=”” top_margin=”0″ bottom_margin=”15px” border_size=”0″ icon=”” icon_circle=”” icon_circle_color=”” width=”” alignment=”center” /][fusion_text columns=”” column_min_width=”” column_spacing=”” rule_style=”default” rule_size=”” rule_color=”” hide_on_mobile=”small-visibility,medium-visibility,large-visibility” class=”” id=”” animation_type=”” animation_direction=”left” animation_speed=”0.3″ animation_offset=””]The Redin estimate decreased by about $2,300 while Zillow was up half that and Redfin up $400. Largely due to the drop in the Redfin estimate, the AVERAGE estimate decreased by $235. You can see in the video here that both Redfin and Realtor exhibit some strange behavior. I’m not sure if I’m picking off the wrong number or if they are retroactively changing the estimates?
[fusion_youtube id=”O1ESs37LmeU” alignment=”center” width=”800″ height=”” autoplay=”false” api_params=”” hide_on_mobile=”small-visibility,medium-visibility,large-visibility” class=”” css_id=””][/fusion_youtube]
[fusion_separator style_type=”none” hide_on_mobile=”small-visibility,medium-visibility,large-visibility” class=”” id=”” sep_color=”” top_margin=”0″ bottom_margin=”15px” border_size=”0″ icon=”” icon_circle=”” icon_circle_color=”” width=”” alignment=”center”][/fusion_separator]
Still no need to worry. The trend is up. We made a few bucks on the mortgage paydown ($193) and a few more on the income side ($374 using ‘checkbook accounting’). The equity will take care of itself.[/fusion_text][/fusion_builder_column][/fusion_builder_row][/fusion_builder_container]