[fusion_builder_container hundred_percent=”no” hundred_percent_height=”no” hundred_percent_height_scroll=”no” hundred_percent_height_center_content=”yes” equal_height_columns=”no” menu_anchor=”” hide_on_mobile=”small-visibility,medium-visibility,large-visibility” status=”published” publish_date=”” class=”” id=”” background_color=”” background_image=”” background_position=”center center” background_repeat=”no-repeat” fade=”no” background_parallax=”none” enable_mobile=”no” parallax_speed=”0.3″ video_mp4=”” video_webm=”” video_ogv=”” video_url=”” video_aspect_ratio=”16:9″ video_loop=”yes” video_mute=”yes” video_preview_image=”” border_size=”” border_color=”” border_style=”solid” margin_top=”” margin_bottom=”” padding_top=”” padding_right=”” padding_bottom=”” padding_left=””][fusion_builder_row][fusion_builder_column type=”1_1″ layout=”1_1″ spacing=”” center_content=”no” link=”” target=”_self” min_height=”” hide_on_mobile=”small-visibility,medium-visibility,large-visibility” class=”” id=”” background_color=”” background_image=”” background_image_id=”” background_position=”left top” background_repeat=”no-repeat” hover_type=”none” border_size=”0″ border_color=”” border_style=”solid” border_position=”all” border_radius=”” box_shadow=”no” dimension_box_shadow=”” box_shadow_blur=”0″ box_shadow_spread=”0″ box_shadow_color=”” box_shadow_style=”” padding_top=”” padding_right=”” padding_bottom=”” padding_left=”” margin_top=”” margin_bottom=”” animation_type=”” animation_direction=”left” animation_speed=”0.3″ animation_offset=”” last=”no”][fusion_text columns=”” column_min_width=”” column_spacing=”” rule_style=”default” rule_size=”” rule_color=”” hide_on_mobile=”small-visibility,medium-visibility,large-visibility” class=”” id=””]Our results to date are reported on a monthly basis on the “Score” table on the Home page. We give you the current total value of TheMonopolyProject (TMP) as a combination of cash held (bank deposits) and the estimated equity of the real estate owned (= estimated value minus liabilities).
To determine how well TMP project is doing we compare it to the other financial investments we could have made with the $100,000. This is known as the ‘opportunity cost’. Note that we could also consider other, non-financial investment uses for the $100,000. We will discuss that later. Life is not all about optimizing financial outcomes in this kingdom.
We started TMP on March 1, 2019. On March 1st, 2019, all 10 investments started at the same nominal value, $100,000.
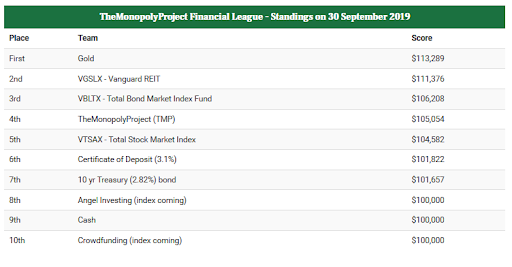
Now that September is completed, we have our results, the “Standings”. It’s easiest to think of this as a football or baseball sports league: The Financial League. We’re one of ten teams competing for First Place in the league.
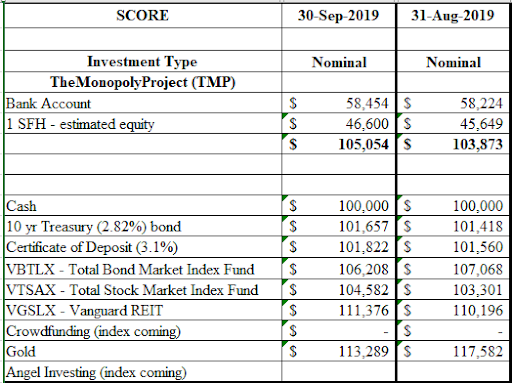
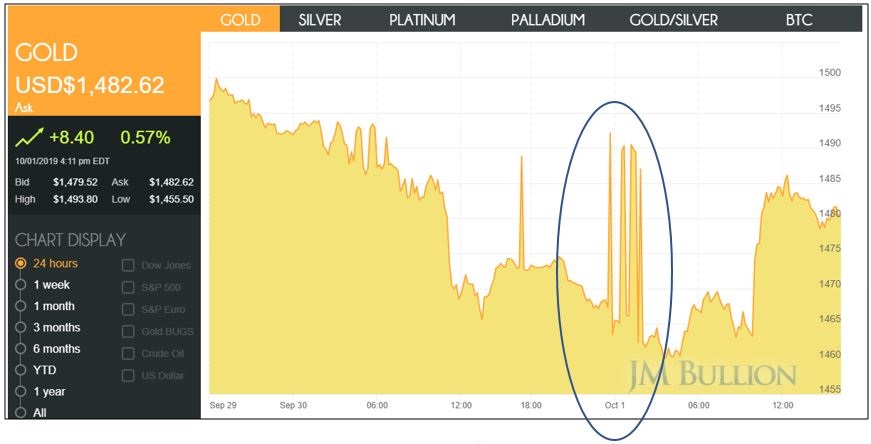
‘Gold’ is still in First Place but fell back 3.5%.[/fusion_text][fusion_separator style_type=”none” hide_on_mobile=”small-visibility,medium-visibility,large-visibility” class=”” id=”” sep_color=”” top_margin=”3%” bottom_margin=”” border_size=”” icon=”” icon_circle=”” icon_circle_color=”” width=”” alignment=”center” /][fusion_imageframe image_id=”1848|full” max_width=”” style_type=”bottomshadow” blur=”” stylecolor=”” hover_type=”none” bordersize=”” bordercolor=”” borderradius=”” align=”center” lightbox=”no” gallery_id=”” lightbox_image=”” lightbox_image_id=”” alt=”” link=”” linktarget=”_self” hide_on_mobile=”small-visibility,medium-visibility,large-visibility” class=”” id=”” animation_type=”” animation_direction=”left” animation_speed=”0.3″ animation_offset=””]https://themonopolyproject.com/wp-content/uploads/2019/10/The-Monopoly-Project-Financial-League.png[/fusion_imageframe][fusion_separator style_type=”none” hide_on_mobile=”small-visibility,medium-visibility,large-visibility” class=”” id=”” sep_color=”” top_margin=”3%” bottom_margin=”” border_size=”” icon=”” icon_circle=”” icon_circle_color=”” width=”” alignment=”center” /][fusion_text columns=”” column_min_width=”” column_spacing=”” rule_style=”default” rule_size=”” rule_color=”” hide_on_mobile=”small-visibility,medium-visibility,large-visibility” class=”” id=””]Interestingly enough, the order has not changed. Some investments went up, some went down, but the order was unchanged. Here’s a direct comparison of the two months results:[/fusion_text][fusion_separator style_type=”none” hide_on_mobile=”small-visibility,medium-visibility,large-visibility” class=”” id=”” sep_color=”” top_margin=”3%” bottom_margin=”” border_size=”” icon=”” icon_circle=”” icon_circle_color=”” width=”” alignment=”center” /][fusion_imageframe image_id=”1849|full” max_width=”” style_type=”bottomshadow” blur=”” stylecolor=”” hover_type=”none” bordersize=”” bordercolor=”” borderradius=”” align=”center” lightbox=”no” gallery_id=”” lightbox_image=”” lightbox_image_id=”” alt=”” link=”” linktarget=”_self” hide_on_mobile=”small-visibility,medium-visibility,large-visibility” class=”” id=”” animation_type=”” animation_direction=”left” animation_speed=”0.3″ animation_offset=””]https://themonopolyproject.com/wp-content/uploads/2019/10/Investment-Type.png[/fusion_imageframe][fusion_separator style_type=”none” hide_on_mobile=”small-visibility,medium-visibility,large-visibility” class=”” id=”” sep_color=”” top_margin=”3%” bottom_margin=”” border_size=”” icon=”” icon_circle=”” icon_circle_color=”” width=”” alignment=”center” /][fusion_text columns=”” column_min_width=”” column_spacing=”” rule_style=”default” rule_size=”” rule_color=”” hide_on_mobile=”small-visibility,medium-visibility,large-visibility” class=”” id=””]Gold went down (about 3.5%) but also exhibited some interesting behavior at the witching hour at the end of the month. You can see in the graph below and video the $30 spikes (about 2%) as we go from September to October. Why? Probably automated trading programs trying to optimize the month’s results. We will use the $1495, midnight value.[/fusion_text][fusion_separator style_type=”none” hide_on_mobile=”small-visibility,medium-visibility,large-visibility” class=”” id=”” sep_color=”” top_margin=”3%” bottom_margin=”” border_size=”” icon=”” icon_circle=”” icon_circle_color=”” width=”” alignment=”center” /][fusion_imageframe image_id=”1868|full” max_width=”” style_type=”bottomshadow” blur=”” stylecolor=”” hover_type=”none” bordersize=”” bordercolor=”” borderradius=”” align=”center” lightbox=”no” gallery_id=”” lightbox_image=”” lightbox_image_id=”” alt=”” link=”” linktarget=”_self” hide_on_mobile=”small-visibility,medium-visibility,large-visibility” class=”” id=”” animation_type=”” animation_direction=”left” animation_speed=”0.3″ animation_offset=””]https://themonopolyproject.com/wp-content/uploads/2019/10/updated-graph-of-gold-spot-price-on-1-oct-2019-with-oval-included.jpg[/fusion_imageframe][fusion_separator style_type=”none” hide_on_mobile=”small-visibility,medium-visibility,large-visibility” class=”” id=”” sep_color=”” top_margin=”3%” bottom_margin=”” border_size=”” icon=”” icon_circle=”” icon_circle_color=”” width=”” alignment=”center” /][fusion_text columns=”” column_min_width=”” column_spacing=”” rule_style=”default” rule_size=”” rule_color=”” hide_on_mobile=”small-visibility,medium-visibility,large-visibility” class=”” id=””]
Gold Spot Price Courtesy of https://www.jmbullion.com
[/fusion_text][fusion_separator style_type=”none” hide_on_mobile=”small-visibility,medium-visibility,large-visibility” class=”” id=”” sep_color=”” top_margin=”3%” bottom_margin=”” border_size=”” icon=”” icon_circle=”” icon_circle_color=”” width=”” alignment=”center” /][fusion_youtube id=”https://youtu.be/rB_2ciAXJ9I” alignment=”center” width=”” height=”” autoplay=”false” api_params=”” hide_on_mobile=”small-visibility,medium-visibility,large-visibility” class=”” css_id=”” /][fusion_separator style_type=”none” hide_on_mobile=”small-visibility,medium-visibility,large-visibility” class=”” id=”” sep_color=”” top_margin=”3%” bottom_margin=”” border_size=”” icon=”” icon_circle=”” icon_circle_color=”” width=”” alignment=”center” /][fusion_text columns=”” column_min_width=”” column_spacing=”” rule_style=”default” rule_size=”” rule_color=”” hide_on_mobile=”small-visibility,medium-visibility,large-visibility” class=”” id=””]For TheMonopolyProject our formula for TOTAL EQUITY is:
TOTAL EQUITY of TMP = ‘Bank Account’ + ‘estimated equity in 1 SFH’ = $105,054
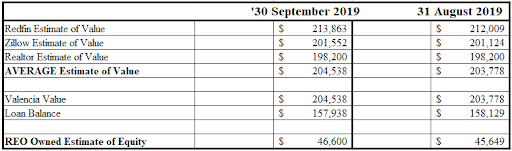
How did we get to the ‘REO Owned Estimate of Equity’ of $46,600 for the month of September?
We used the arithmetic average of the three websites (Redfin, Zillow, Realtor.com).[/fusion_text][fusion_separator style_type=”none” hide_on_mobile=”small-visibility,medium-visibility,large-visibility” class=”” id=”” sep_color=”” top_margin=”3%” bottom_margin=”” border_size=”” icon=”” icon_circle=”” icon_circle_color=”” width=”” alignment=”center” /][fusion_imageframe image_id=”1851|full” max_width=”” style_type=”bottomshadow” blur=”” stylecolor=”” hover_type=”none” bordersize=”” bordercolor=”” borderradius=”” align=”center” lightbox=”no” gallery_id=”” lightbox_image=”” lightbox_image_id=”” alt=”” link=”” linktarget=”_self” hide_on_mobile=”small-visibility,medium-visibility,large-visibility” class=”” id=”” animation_type=”” animation_direction=”left” animation_speed=”0.3″ animation_offset=””]https://themonopolyproject.com/wp-content/uploads/2019/10/arithmetic-average.png[/fusion_imageframe][fusion_separator style_type=”none” hide_on_mobile=”small-visibility,medium-visibility,large-visibility” class=”” id=”” sep_color=”” top_margin=”3%” bottom_margin=”” border_size=”” icon=”” icon_circle=”” icon_circle_color=”” width=”” alignment=”center” /][fusion_text columns=”” column_min_width=”” column_spacing=”” rule_style=”default” rule_size=”” rule_color=”” hide_on_mobile=”small-visibility,medium-visibility,large-visibility” class=”” id=””]
The Redin estimate is unchanged from last month, see video presentation.
[/fusion_text][fusion_separator style_type=”none” hide_on_mobile=”small-visibility,medium-visibility,large-visibility” class=”” id=”” sep_color=”” top_margin=”3%” bottom_margin=”” border_size=”” icon=”” icon_circle=”” icon_circle_color=”” width=”” alignment=”center” /][fusion_youtube id=”https://youtu.be/BOXA4MEGuRg” alignment=”center” width=”” height=”” autoplay=”false” api_params=”” hide_on_mobile=”small-visibility,medium-visibility,large-visibility” class=”” css_id=”” /][fusion_separator style_type=”none” hide_on_mobile=”small-visibility,medium-visibility,large-visibility” class=”” id=”” sep_color=”” top_margin=”3%” bottom_margin=”” border_size=”” icon=”” icon_circle=”” icon_circle_color=”” width=”” alignment=”center” /][fusion_text columns=”” column_min_width=”” column_spacing=”” rule_style=”default” rule_size=”” rule_color=”” hide_on_mobile=”small-visibility,medium-visibility,large-visibility” class=”” id=””]
Not sure if the $212,009 for August above is an error or they changed it? The Redfin site has the interesting comment “$14K since sold in 2019”. If that is true, we made $14K; that’s 35% on the $40K down payment, more if annualized. If we add closing costs, especially if we would have gotten a “real” loan, it is still better than 30%. And on the complete purchase price, ignoring the loan from ‘The Bank of Michelle’, it is about 7%.
Realtor.com also shows no change from last month:
[/fusion_text][fusion_separator style_type=”none” hide_on_mobile=”small-visibility,medium-visibility,large-visibility” class=”” id=”” sep_color=”” top_margin=”3%” bottom_margin=”” border_size=”” icon=”” icon_circle=”” icon_circle_color=”” width=”” alignment=”center” /][fusion_youtube id=”https://youtu.be/sCoCRYd3vC4″ alignment=”center” width=”” height=”” autoplay=”false” api_params=”” hide_on_mobile=”small-visibility,medium-visibility,large-visibility” class=”” css_id=”” /][fusion_separator style_type=”none” hide_on_mobile=”small-visibility,medium-visibility,large-visibility” class=”” id=”” sep_color=”” top_margin=”3%” bottom_margin=”” border_size=”” icon=”” icon_circle=”” icon_circle_color=”” width=”” alignment=”center” /][fusion_text columns=”” column_min_width=”” column_spacing=”” rule_style=”default” rule_size=”” rule_color=”” hide_on_mobile=”small-visibility,medium-visibility,large-visibility” class=”” id=””]They go on to state: “Valencia Dr is likely to appreciate by 4% in the next year, based on the latest home price index. In the last 3 years, this home has increased its value by 42%.” Interesting.
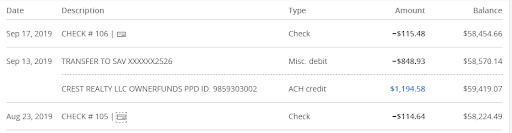
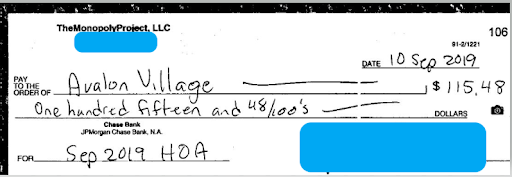
Using our formula: TOTAL EQUITY of TMP = ‘Bank Account’ + ‘estimated equity in 1 SFH’ the change in TOTAL EQUITY is $1,181 consisting of $760 in appreciation plus $191 in principal paydown plus $1,194 rent collected minus $848 mortgage payment (the $191 is included in that payment) minus $115 for HOA fees[/fusion_text][fusion_separator style_type=”none” hide_on_mobile=”small-visibility,medium-visibility,large-visibility” class=”” id=”” sep_color=”” top_margin=”3%” bottom_margin=”” border_size=”” icon=”” icon_circle=”” icon_circle_color=”” width=”” alignment=”center” /][fusion_imageframe image_id=”1852|full” max_width=”” style_type=”bottomshadow” blur=”” stylecolor=”” hover_type=”none” bordersize=”” bordercolor=”” borderradius=”” align=”center” lightbox=”no” gallery_id=”” lightbox_image=”” lightbox_image_id=”” alt=”” link=”” linktarget=”_self” hide_on_mobile=”small-visibility,medium-visibility,large-visibility” class=”” id=”” animation_type=”” animation_direction=”left” animation_speed=”0.3″ animation_offset=””]https://themonopolyproject.com/wp-content/uploads/2019/10/TMP-Bank-Account-Transactions-for-Month-of-September.png[/fusion_imageframe][fusion_separator style_type=”none” hide_on_mobile=”small-visibility,medium-visibility,large-visibility” class=”” id=”” sep_color=”” top_margin=”3%” bottom_margin=”” border_size=”” icon=”” icon_circle=”” icon_circle_color=”” width=”” alignment=”center” /][fusion_text columns=”” column_min_width=”” column_spacing=”” rule_style=”default” rule_size=”” rule_color=”” hide_on_mobile=”small-visibility,medium-visibility,large-visibility” class=”” id=””]
TMP Bank Account Transactions for Month of September
[/fusion_text][fusion_separator style_type=”none” hide_on_mobile=”small-visibility,medium-visibility,large-visibility” class=”” id=”” sep_color=”” top_margin=”3%” bottom_margin=”” border_size=”” icon=”” icon_circle=”” icon_circle_color=”” width=”” alignment=”center” /][fusion_imageframe image_id=”1853|full” max_width=”” style_type=”bottomshadow” blur=”” stylecolor=”” hover_type=”none” bordersize=”” bordercolor=”” borderradius=”” align=”center” lightbox=”no” gallery_id=”” lightbox_image=”” lightbox_image_id=”” alt=”” link=”” linktarget=”_self” hide_on_mobile=”small-visibility,medium-visibility,large-visibility” class=”” id=”” animation_type=”” animation_direction=”left” animation_speed=”0.3″ animation_offset=””]https://themonopolyproject.com/wp-content/uploads/2019/10/HOA.png[/fusion_imageframe][fusion_separator style_type=”none” hide_on_mobile=”small-visibility,medium-visibility,large-visibility” class=”” id=”” sep_color=”” top_margin=”3%” bottom_margin=”” border_size=”” icon=”” icon_circle=”” icon_circle_color=”” width=”” alignment=”center” /][fusion_text columns=”” column_min_width=”” column_spacing=”” rule_style=”default” rule_size=”” rule_color=”” hide_on_mobile=”small-visibility,medium-visibility,large-visibility” class=”” id=””]For now, we’re still in 4th place and moving up. This is how we foresaw TMP performing. We are buying appreciating assets on margin (80% down). We make money on the appreciated value of our down payment money PLUS the value of the borrowed money.
In the meantime, stay out of our pantry. You might get stung.[/fusion_text][fusion_separator style_type=”none” hide_on_mobile=”small-visibility,medium-visibility,large-visibility” class=”” id=”” sep_color=”” top_margin=”3%” bottom_margin=”” border_size=”” icon=”” icon_circle=”” icon_circle_color=”” width=”” alignment=”center” /][fusion_youtube id=”https://youtu.be/FCsGnDLYrMg” alignment=”center” width=”” height=”” autoplay=”false” api_params=”” hide_on_mobile=”small-visibility,medium-visibility,large-visibility” class=”” css_id=”” /][/fusion_builder_column][/fusion_builder_row][/fusion_builder_container]